Chances are fairly good that we get our first dusting of snow on Friday as cold air pours after what's left of Sandy leaves.
Then again next week..
Wednesday, October 31, 2012
Two Graphs you must see
About Hurricanes.
First from Dr. Ryan Maue
 Second from Steven Goddard based on NOAA's Hurricane database.

First from Dr. Ryan Maue


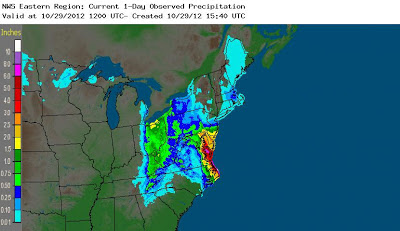
Precip totals from Sandy..
The first map is precip totals over the last seven days. The vast majority of that is from Sandy. The second map shows that a portion of the precip fell as snow in the West Virginina and Maryland.


Tuesday, October 30, 2012


Monday, October 29, 2012
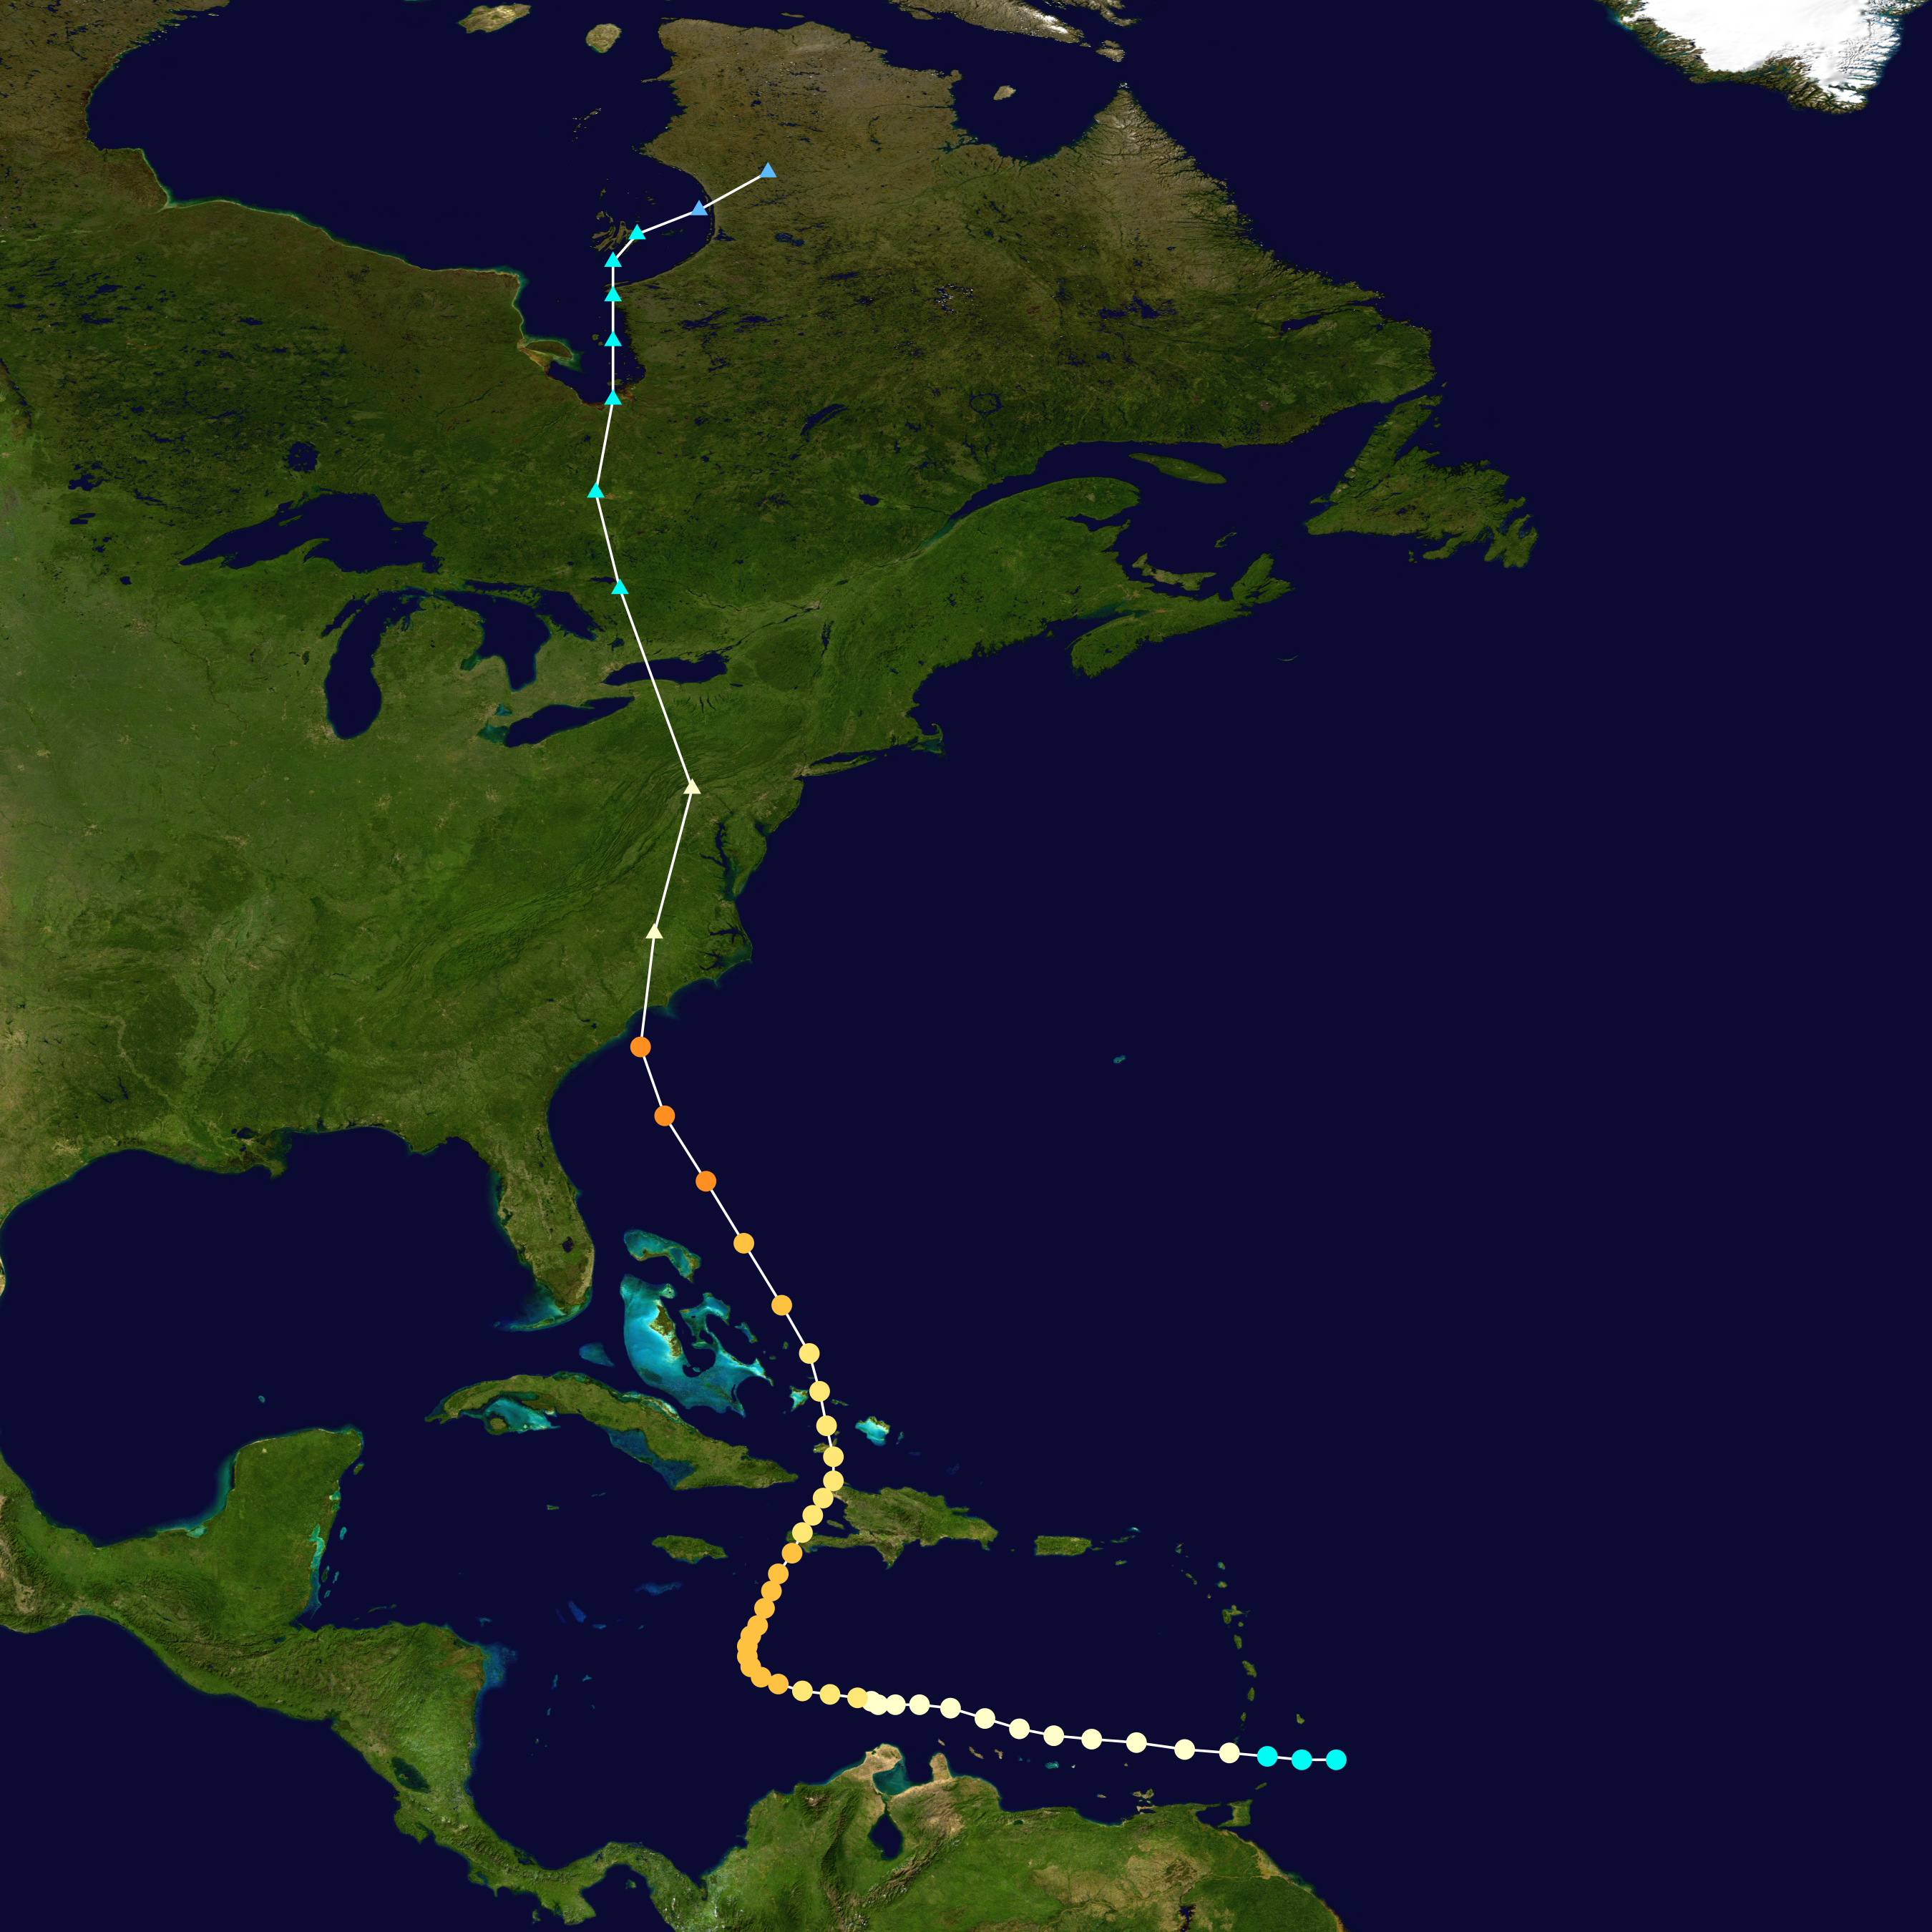
Past NE US Hurricanes...to show a few
All this talk of unprecedentness of Sandy really chokes me. Here's why.
 |
| 1938 Great Hurricane (Cat 3 @ landfall) |
 |
| Hurricane Carol (Cat 3 @ Landfall Aug. 30, 1954) |
 |
| Hurricane Edna (Cat 1 @ landfall Sept. 11, 1954) |
 |
| Hurricane Hazel (Cat. 4 @ landfall Oct. 15, 1954) |
 |
| Hurricane Connie (Cat. 1 @landfall Aug. 12, 1955) |
 |
| Hurricane Diane (Cat. 1 @ landfall, Aug. 17, 1955) |
 |
| Hurricane Ione (Cat 1. @ landfall Sept.19, 1955) |
Sandy update
It may get a little windy (60km/h average) in the southern and eastern Ontario areas, but by far the greatest impact of Sandy continues to be in the NE US with flooding with the greatest concern, on the coast from 10-15ft of storm surge, high tide and inches of rain, and inland from all the rain. The wind in the NE US will be of hurricane force, decreasing the more time the storm center is over land.
Here are two maps showing first what has fallen over the last 24hrs and what is predicted to fall over the next 72 hours.

Here are two maps showing first what has fallen over the last 24hrs and what is predicted to fall over the next 72 hours.


Saturday, October 27, 2012
Impacts of Sandy.
Update: Oh, and let's not forget the wind.
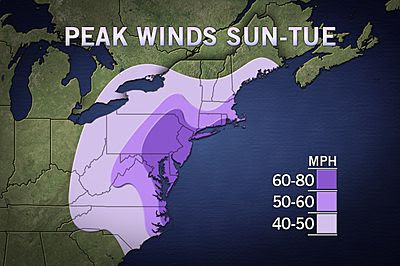
Just a couple maps about the impacts of Sandy. She is predicted to impact the south Jersey shore Monday night with Cat. 1 hurricane force winds and a LOT of rain.
The first map is from NOAA with it's day 3 to 7 severe weather outlook. The second is a precipation total over the next five days from the GFS model. I have been so impressed with the Euro models wrt Sandy. It has been consistant over the last week. Every other model come around to its solution.
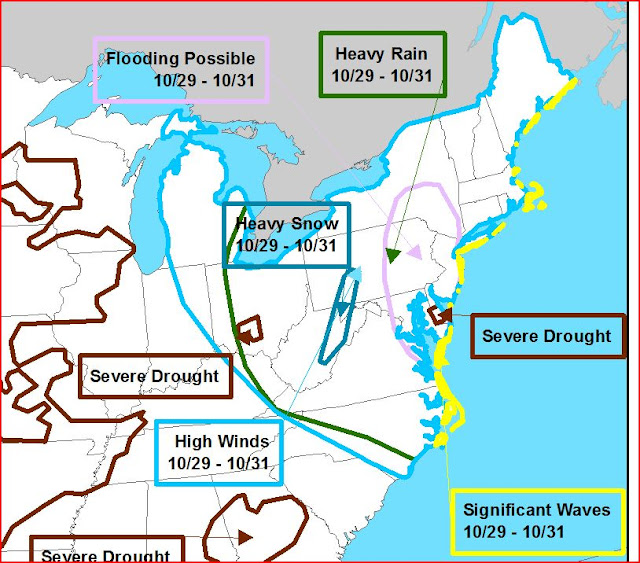


Friday, October 26, 2012
See if my comment gets published.
Update 2: My response to the response is NOT getting published.

Update: It did get published with some inane comment about Sandy is not simply a tropical storm. Pphhtt.
At a Planet3.0.org blog post... I think not. Here's a screen capture of my comment awaiting moderation.


Update: It did get published with some inane comment about Sandy is not simply a tropical storm. Pphhtt.
At a Planet3.0.org blog post... I think not. Here's a screen capture of my comment awaiting moderation.

Thursday, October 25, 2012
Putting a damper on Halloween
This from the GFS model valid next Wednesday evening. If true (the devil is in the details), that would mean rain and 40 km/h winds with gust to 80 km/h.


Latest update on Sandy
As you can see below, virtually all the models are calling for the western track with the majority calling for a landfall somewhere between Virginia and Maine around the Monday/Tuesday timeframe, with the more south landfall being earlier. Regardless, it gonna get ugly.

Wednesday, October 24, 2012
Latest model update on Sandy
Update: The Canadian is back on board..Kumbaya.
The Euro is consistant run to run with Sandy hammering the US NE. The GFS now captures it and brings it west albeit different time and location than the Euro. The Canadian has lost it and shoots Sandy out to sea.

The Euro is consistant run to run with Sandy hammering the US NE. The GFS now captures it and brings it west albeit different time and location than the Euro. The Canadian has lost it and shoots Sandy out to sea.

Sandy is going to rock the house
More and more models are coming around to the western track (see below)

If the Euro is correct (and it's been consistant), it would be a major disruptive storm. With landfall about next Tuesday, it would mean heavy rain and wind for the NE US and eastern Ontario and FEET (2-3 in some areas) of snow in the interior mountains of Western Pennsylvania and New York and significant accumulations in central Ontario. We in Ottawa may even see our first measurable snow fall from Sandy.

If the Euro is correct (and it's been consistant), it would be a major disruptive storm. With landfall about next Tuesday, it would mean heavy rain and wind for the NE US and eastern Ontario and FEET (2-3 in some areas) of snow in the interior mountains of Western Pennsylvania and New York and significant accumulations in central Ontario. We in Ottawa may even see our first measurable snow fall from Sandy.
Tuesday, October 23, 2012
Sandy, Sandy
Will cause no end of headaches. Here is a map showing the spread of model outputs (different models) for the track of Sandy. Note the ones going inland are ones like the Euro, Canadian, UKMET, JMA. The ones going out to sea are the GFS and DGEX. And even of those that are predicting landfall, the timing is varying by days.


Monday, October 22, 2012
Hooboy...
We may be looking at an ending of October and beginning of November to remember, so to speak, a la Hurricane Hazel. Some of the models are predicting this, including the Euro, Canadian and Japanese. There is a new tropical storm brewing in the Caribbean which will be "Sandy". It's currently predicted to come north over Jamaica, Cuba and the Bahamas. It is then that there is the greatest divergence of tracks with the GFS taking it out to sea. However, the latest run of the Euro pulled it in at Virginia/Pennsylvania and up into Ontario.
Stay tuned..
Stay tuned..
Ski season is starting...
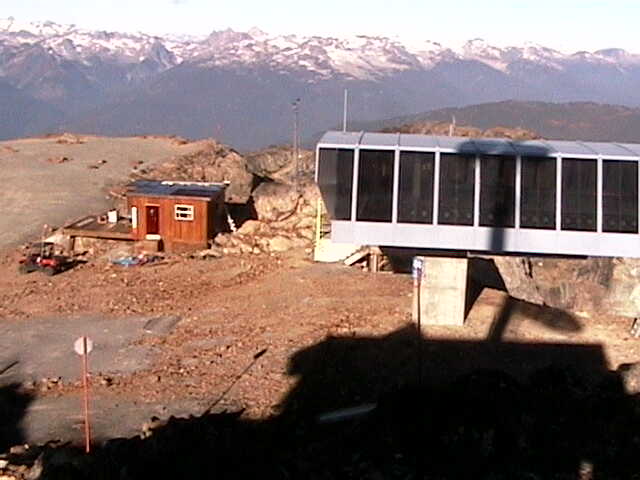
In the west. Remember how I mentioned in my Oct 10th post that the ski hills of BC would be getting a whole lot whiter over the following couple of weeks. Well, it happened. Here is what Whistler looked like October 10th.
 And here is what it looks like now.


Friday, October 19, 2012
Not so Happy Halloween
The end of the month outlook is looking cool (and whitish?). You may want to let your little trickortreaters know that conditions may not be conducive to walking about the neighbourhood.
Thursday, October 18, 2012
Some more climate stuff
More of the climate been there, done that mode, there has been two papers published showing the current warm period (CWP) has been matched and exceeded in the past.
The first paper is regarding Scandanavian summer (read melt season) temperature over the last 2 millenium. Give the media hype about the Arctic Sea Ice "record" low this year, it pays to remind readers that this is not unusual. If air temperature is the only driver (and it's not!) of sea ice levels, then this study shows that temperatures in the far North have been higher for longers periods of time than currently.

The second paper is a Northern Hemispheric compilation of paleoclimate proxies which show that the Medievial Warm Period (MWP) temperatures match and exceed in some cases the CWP. Not only that, but the rate of change is also not unprecedented.

Wednesday, October 17, 2012
16 years of non-Global warming?
You may seen articles and stuff about a supposed 16 year pause in global warming. There's been all kinds of spin on both sides of the AGW debate. Here is my take:
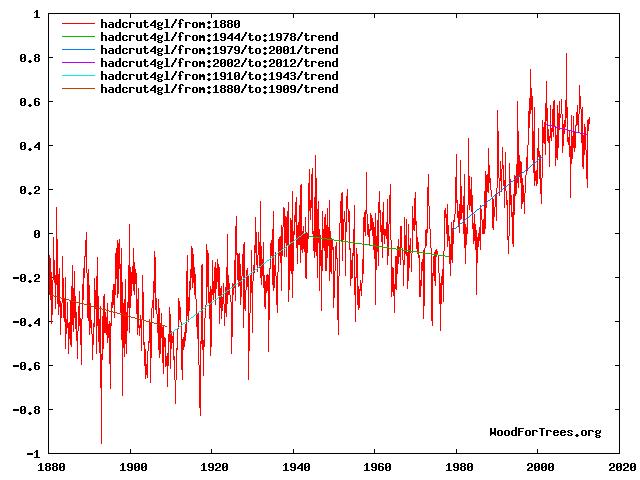
Visually speaking, yes the global surface temperature in September was virtually the same as the global temperature in early 1997. Mathematically speaking, there is still a positive trend line between those two points, given all the monthly data points in between. I prefer the graph below created here.
 Some would argue that the Global temperature is dominated by the oceans and in particular the ENSO. I would argue that natural variations, including oceanic oscillations, account for the majority of the changes we have seen.
Visually speaking, yes the global surface temperature in September was virtually the same as the global temperature in early 1997. Mathematically speaking, there is still a positive trend line between those two points, given all the monthly data points in between. I prefer the graph below created here.
It shows the HADCRUT4 dataset from 1880 until now with trend lines shown in various periods. As far as I am concerned, the true starting point of the current negative trend is 2002 (ie 10years and counting) at a rate that is similar to the trendline value from the mid-1940's to the late 70's and 1880 to 1910. Note that among climate scientists, it is generally accepted that AGW supposedly began in the last half of the 20th Century. As Judy Curry notes, skeptical arguments stem in part from the "Failure of climate models to provide a consistent and convincing attribution argument for the warming from 1910-1940 and the plateau from the 1940′s to the 1970′s", ie what caused the warming in the early 20th century and what caused the cooling in the mid part?
I am not the only one who interprets the surface record this way. See pgs 21 and 22 here.

Tuesday, October 16, 2012
New rules for first snow predictions
Apparently, the flurry of snow that we had last Friday counted as a "trace" of snow. So I am changing the conditions. The predictions is now for the date of the first "measurable" amount of snow.
By the way, I have NOT received any predictions. Work with me people.
By the way, I have NOT received any predictions. Work with me people.
Monday, October 15, 2012
Winter arriving in the west
As I opined in Wednesday's post, cold and snow is coming to western Canada. Brett A. at Accuweather beat me to a detailed posting... I was/am going to post the same picture as he. Here is the GFS Ensemble temperature departures from normal (degree F) over the next week. But I'll go one further, showing the week two temperatures departures courtesy of Weatherbell which shows it still cold in the west but spreading east.


Friday, October 12, 2012
Snow in the air...
Snow has been reported flying in Bell's Corners and Barrhaven this afternoon. Likely won't be measurable though.
Wednesday, October 10, 2012
First snow predictions
Here is your next opportunity for prediction/guessing game. When do you think Ottawa's first snow will come as measured at Ottawa Airport, amounts of trace or more? Leave your predictions in the comments and please let me know who you are.
On a related note, BC's ski hills will be getting a whole lot whiter over the next couple weeks as a trough finally brings precipitation and cooler temps to the region.
On a related note, BC's ski hills will be getting a whole lot whiter over the next couple weeks as a trough finally brings precipitation and cooler temps to the region.
Tuesday, October 9, 2012
First frost prediction winner is..
Anonymous.
Of two, count 'em, two predictions, mine (Sept. 22nd) and Anonymous (Sept. 26th), Anonymous gets the bragging rights of being less wrong than me.
Next up, first snow...
Of two, count 'em, two predictions, mine (Sept. 22nd) and Anonymous (Sept. 26th), Anonymous gets the bragging rights of being less wrong than me.
Next up, first snow...
Friday, October 5, 2012
Next weekend temperatures
Actually a five day view of temperature anomolies from Oct 11 thru 15th.
First from NOAA. Note though as I've mentioned in the past, this ain't a temperature "forecast", this is a probability forecast for above, neutral or below normal temperatures. It doesn't indicate how much above or below the temperatures will be.

Next is from the GFS model, giving actual temperature departures from normal, courtesy of Weatherbell.

Thursday, October 4, 2012
Thanksgiving and next week
Thanksgiving weekend is going to be cool with the odd shower here and there, maybe some non-sticking white stuff. I think we will break the freezing mark at some point this weekend.
There will be a brief warmup on Tuesday, but Wednesday looks to be ugly and continuing cool until next weekend beyond which the models wildly diverge.
There will be a brief warmup on Tuesday, but Wednesday looks to be ugly and continuing cool until next weekend beyond which the models wildly diverge.
Current forecast for Kenora
Winter storm warning in effect.
- Today: Periods of rain changing to wet snow at times heavy this morning. Snowfall amount 10 cm. Wind northeast 20 km/h becoming north 40 gusting to 60 this afternoon. Temperature steady near plus 2.
- Tonight: Snow. Amount 5 to 10 cm. Wind north 40 km/h gusting to 60. Low zero.
- Friday: Snow changing to wet snow late in the morning. Amount 2 to 4 cm. Wind north 30 km/h. High plus 2.

Wednesday, October 3, 2012

Tuesday, October 2, 2012
Don't want to be in Kenora on Friday.
Just sayin'.
 Yes that is in inches of snow. Even if that is half true, not nice.

Monday, October 1, 2012
Less than pleasant Thanksgiving weekend..
Cold front coming on Friday and another one on Saturday will bring chilly damp conditions with a chance of the f-word (flurries!) Saturday and Sunday evening. We should see our first sub-zero temperatures this coming weekend. The models are not quite in agree with the timing and direction but generally speaking Sunday looks to be the worst of the long weekend.
The following weekend doesn't look too nice either.
The following weekend doesn't look too nice either.
Subscribe to:
Posts (Atom)